How it works

From raw signal to defensible action.

Ten connected capabilities form one continuous investigation loop. Each answer stays traceable to the data, assumptions, and evidence that produced it.

01 Reconstruct02 Detect03 Explain04 Act
01

PHASE 1

Reconstruct

Build a complete digital picture of your supply network and correlate every data source that touches it, so every event has a place on the map.

01Capability ready

Supply chain mapping

A comprehensive digital representation of your supply network, so every event has a place on the map.

  • Tier 1, 2, and 3 suppliers
  • Manufacturing plants and distribution centers
  • Transportation routes, ports, and border crossings
  • Customers and demand locations
02Capability ready

Data integration

Forencian collects and correlates data from across your systems and the outside world.

  • ERP, MES, WMS, TMS, and procurement systems
  • Supplier scorecards and IoT sensors
  • Weather, logistics, and commodity market feeds
  • News and geopolitical intelligence
02

PHASE 2

Detect

Surface weak signals across supplier, manufacturing, logistics, inventory, and demand risks, then score them so mitigation effort goes where it counts.

03Capability ready

Risk identification

Systematic coverage of the risks that matter across the whole operation.

  • Supplier: financial distress, capacity shortages, single-source dependency
  • Manufacturing: downtime, quality excursions, yield losses
  • Logistics: port congestion, carrier failures, customs issues
  • Inventory, demand, and external risks, from weather to regulation
04Capability ready

Detection analytics

Advanced analytics surface weak signals before they become major disruptions.

  • Increasing lead times and rising defect rates
  • Supplier performance deterioration
  • Transportation bottlenecks and inventory imbalances
  • Demand anomalies and capacity constraints
05Capability ready

Risk scoring

Every identified risk is scored so mitigation effort goes where it counts.

  • Likelihood and operational impact
  • Financial and customer impact
  • Time to detect and time to recover
03

PHASE 3

Explain

The forensic core: trace disruptions to their root cause with evidence, forecast what breaks next, and simulate what-if scenarios before committing.

06Capability ready

Root cause analysis

The forensic core: move beyond symptoms to determine why a disruption occurred, and prove it.

  • Was the production delay caused by a supplier shortage?
  • Was the shortage due to transportation delays? Did weather contribute?
  • Was there a planning or forecasting error?
  • The causal chain, reconstructed with evidence
07Capability ready

Predictive risk analytics

Machine learning and statistical models forecast what is likely to break next.

  • Potential stockouts and supplier failures
  • Production delays and delivery disruptions
  • Demand surges and capacity shortages
08Capability ready

Scenario analysis & digital twins

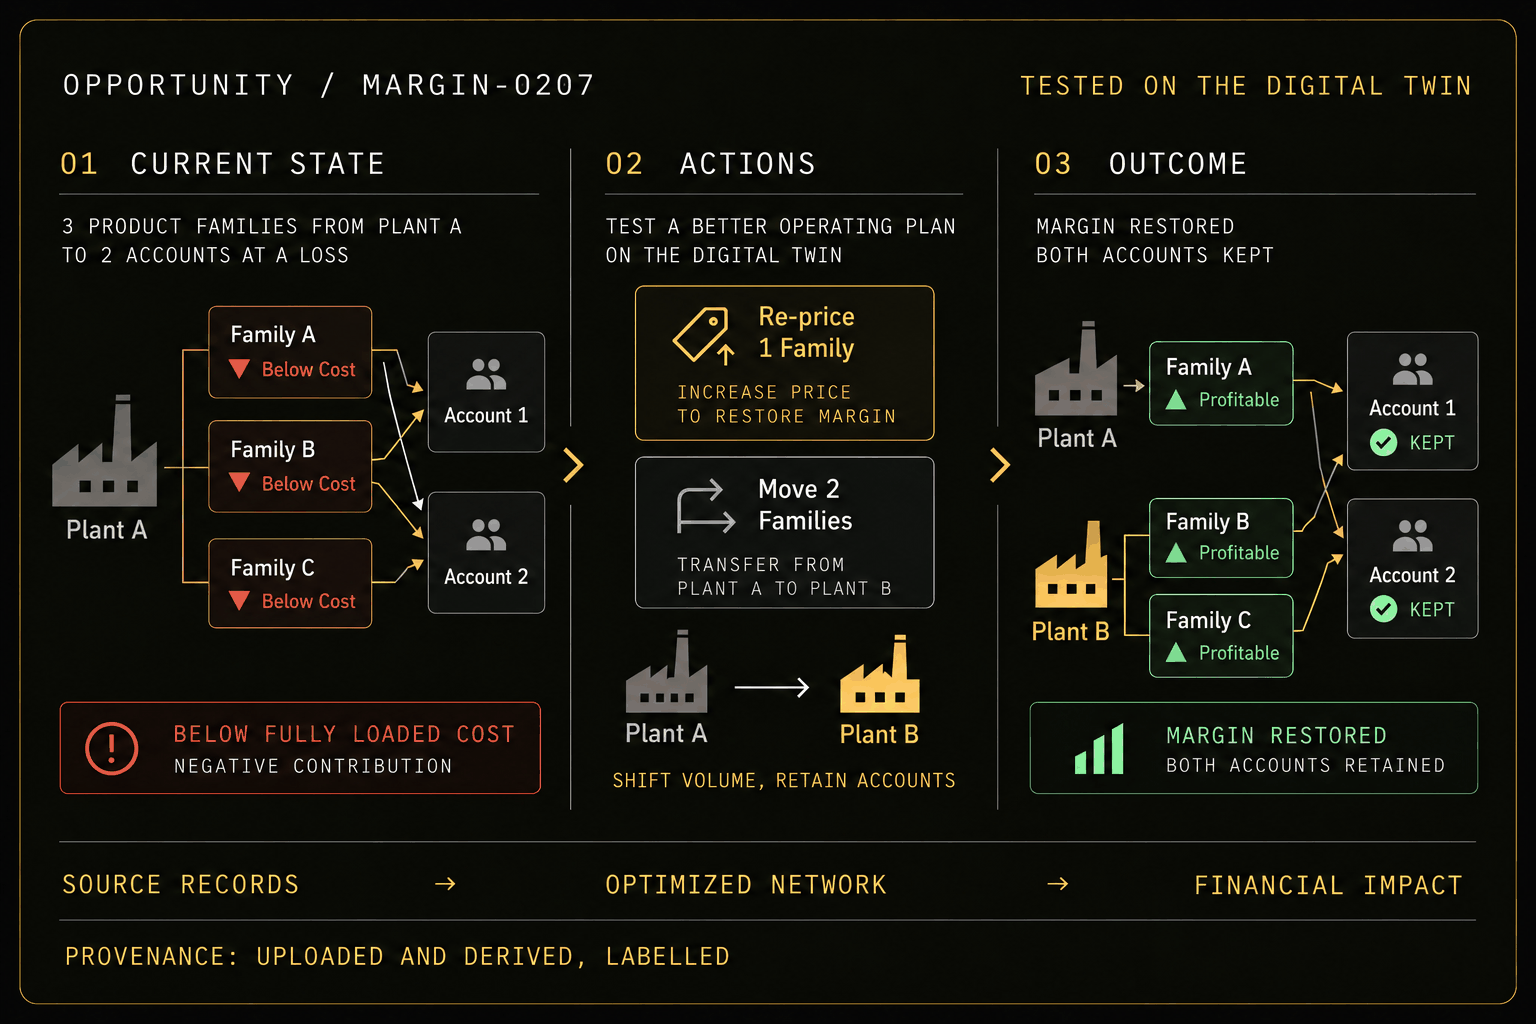
Simulate what-if scenarios and evaluate alternative strategies before disruptions occur.

  • What if a supplier shuts down, or a port closes?
  • What if demand doubles, or tariffs increase?
  • Compare alternative sourcing, production, and logistics strategies
04

PHASE 4

Act

Early warnings before disruptions reach your customers, paired with evidence-backed recommendations: expedite, re-source, rebalance, or shift production.

09Capability ready

Early warning system

Alerts fire when risk thresholds are exceeded, before the disruption reaches your customers.

  • Supplier performance declines
  • Inventory below critical levels
  • Lead times or transportation delays beyond acceptable limits
  • Demand deviating significantly from forecast
10Capability ready

Decision support

Not just alerts: actionable, evidence-backed recommendations.

  • Shift production or expedite critical shipments
  • Qualify alternative suppliers and adjust procurement
  • Increase safety stock or rebalance inventory across DCs
  • Reroute transportation

Built for trust

No black-box verdicts.

Every finding keeps its chain of custody: the source events, the model logic, the assumptions, and the tradeoffs behind the recommended action.

FINDING / 0063187% confidence
Supplier capacity constraint is the primary driver of projected stockout.
14 sources6 hypotheses tested1 causal path

See the method run on a problem like yours.

A focused demo takes one case from scattered data to root cause and recommended response.